

Reference
Complete reference for all Test UI features and interface sections
Test UI is a browser interface for reviewing completed acton test runs with traces, transaction trees, logs, source links, and coverage data when the run includes --coverage.
1. Start Test UI
# Run tests and open Test UI in browser
acton test --ui
Useful options:
# Custom UI port
acton test --ui --ui-port 23456

# Run only selected tests in UI
acton test tests/counter.test.tolk --ui --filter "test deploy"

# Open Test UI with coverage viewer enabled
acton test --coverage --ui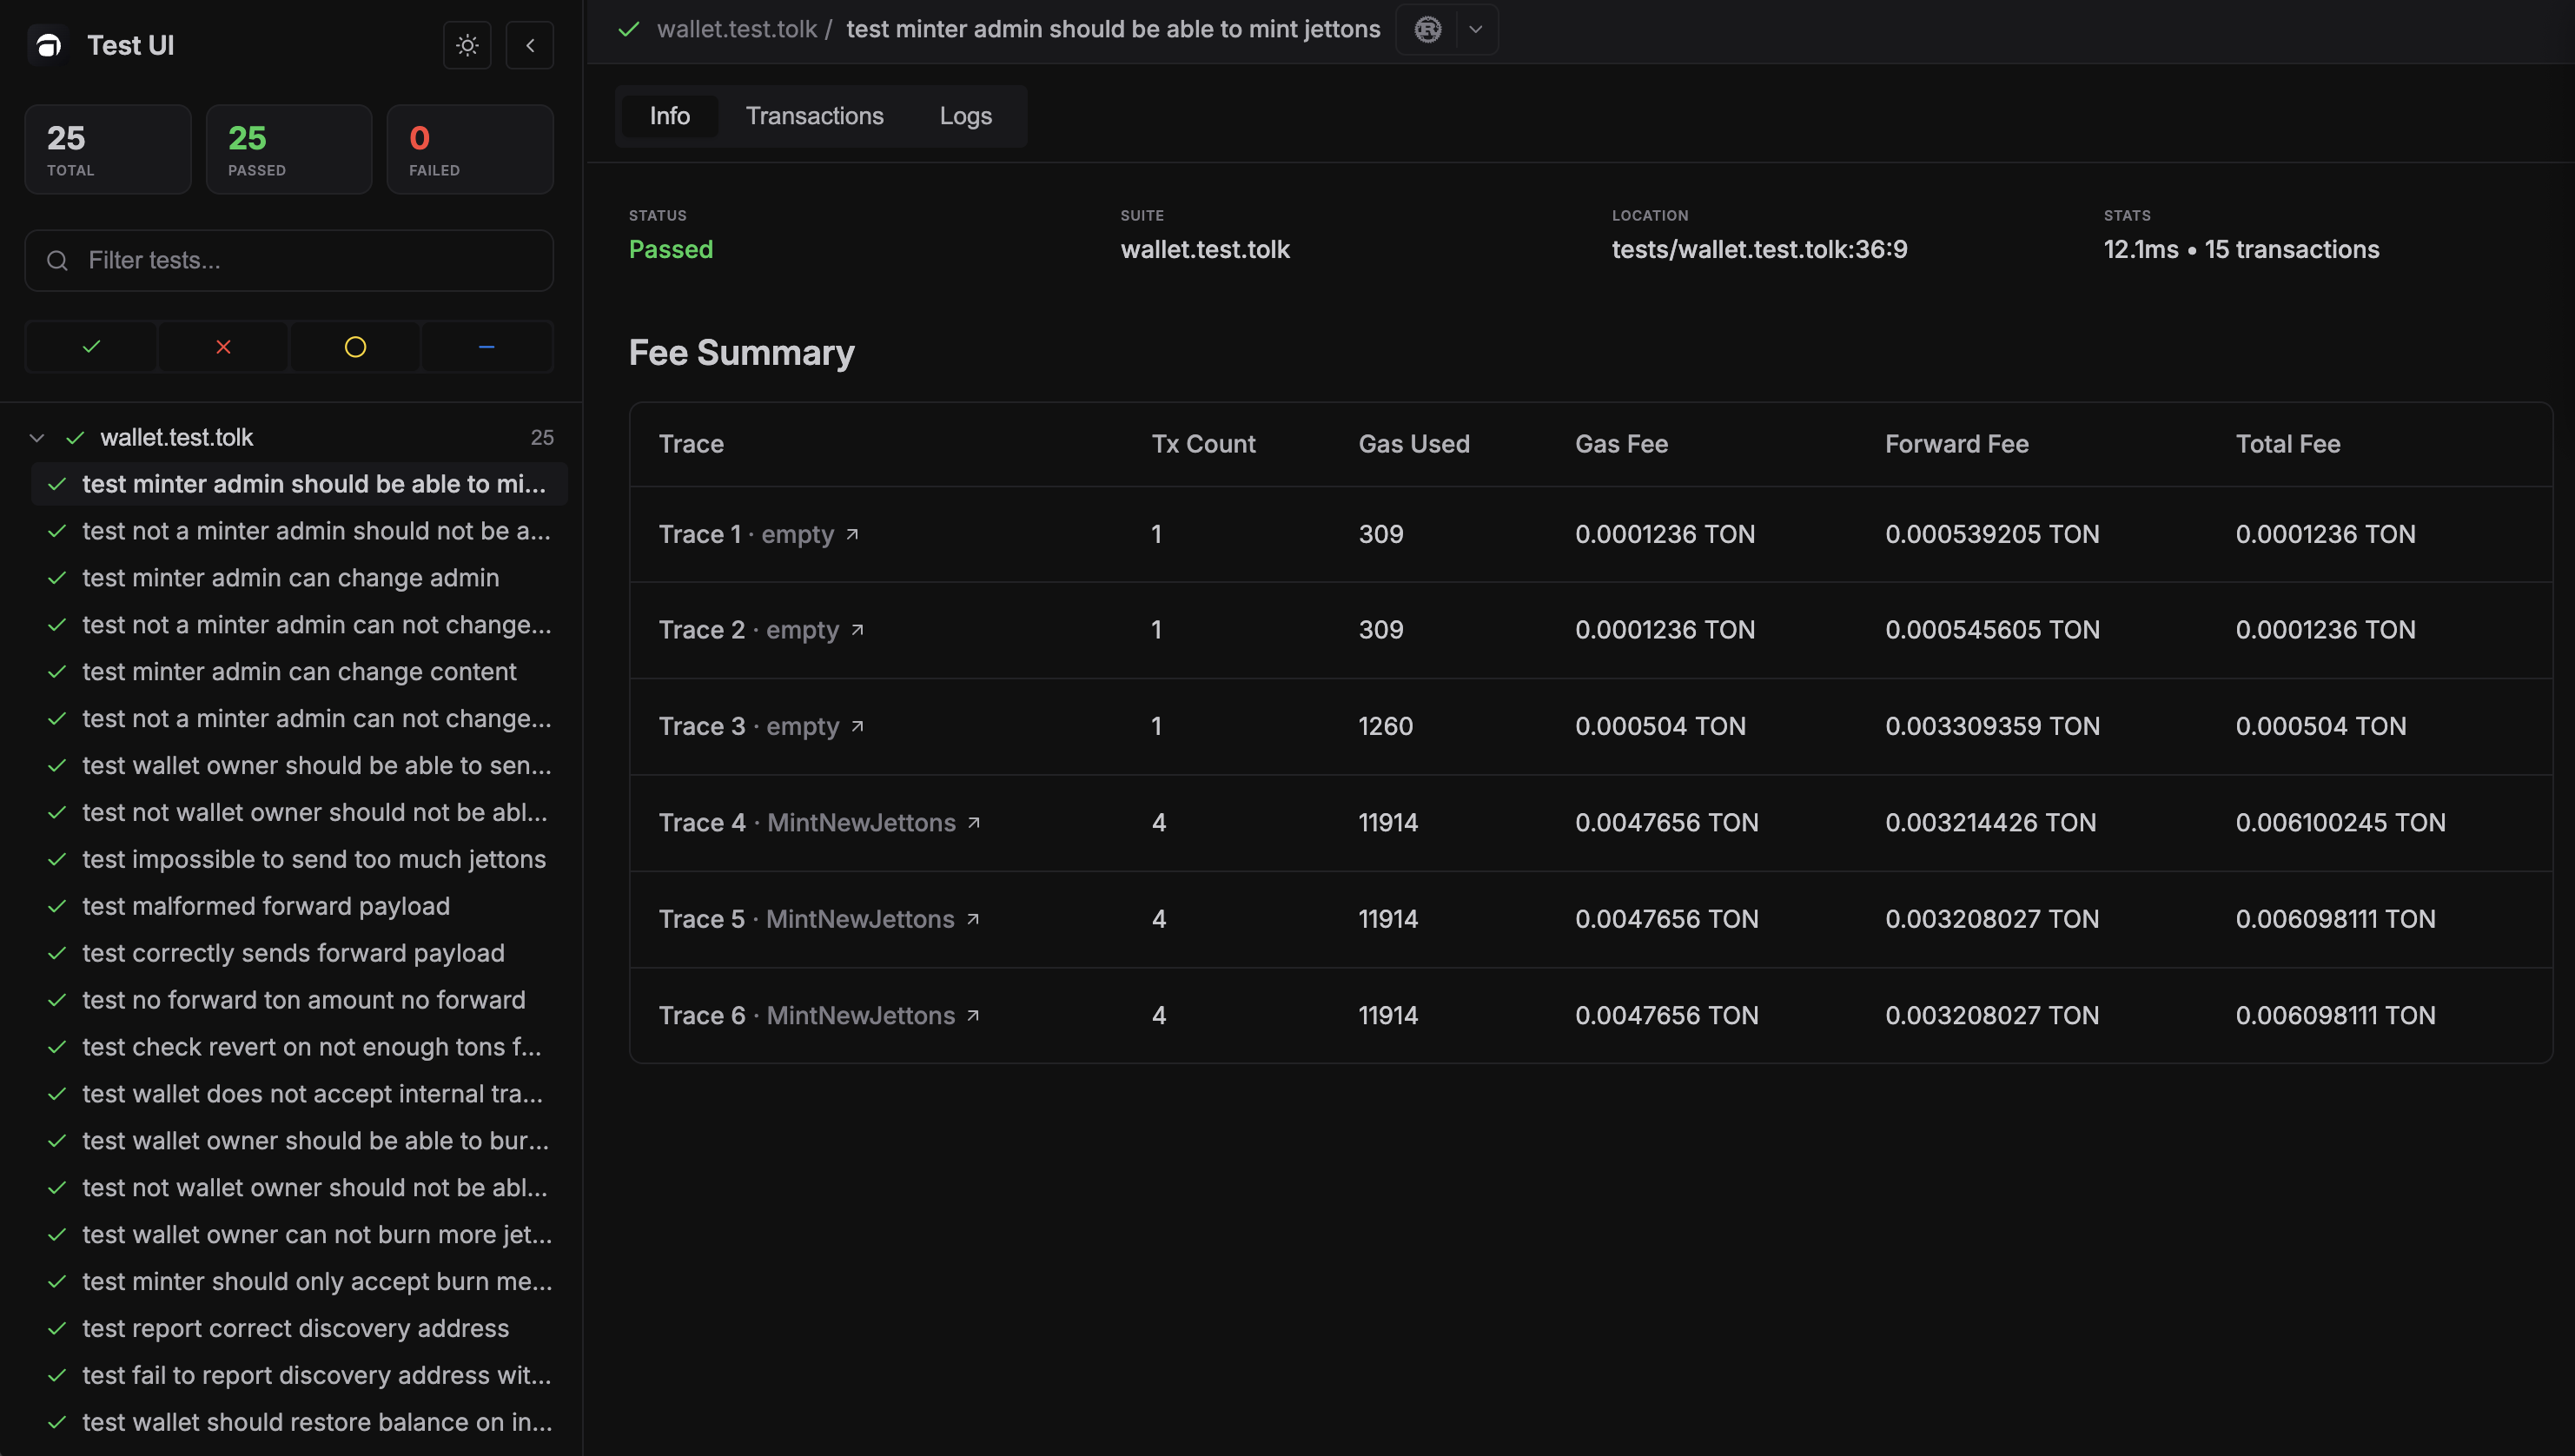
If --ui-port is already in use, Test UI server cannot start. Choose another
free port, for example --ui-port 23456.
The Coverage tab is available only when the test run is started with both
--coverage and --ui.
2. Sidebar features
Test search and status filters
- Text filter (
Filter tests...) matches test names - Status toggles for all statuses:
Passed,Failed,Skipped,Todo
Both can be used simultaneously.
Suite and test navigation
- Tests are grouped by files
- Each suite can be collapsed/expanded
- Suite row shows number of visible tests
- Suite status icon highlights failed suites
- Clicking a test opens full details on the right
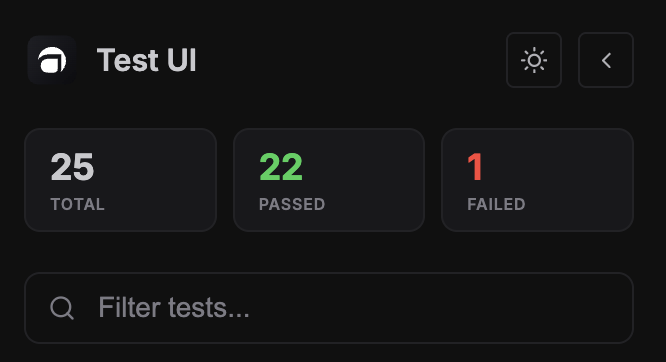
Sidebar controls
- Theme toggle (
light/dark) - Collapse sidebar button
3. Test header and IDE integration
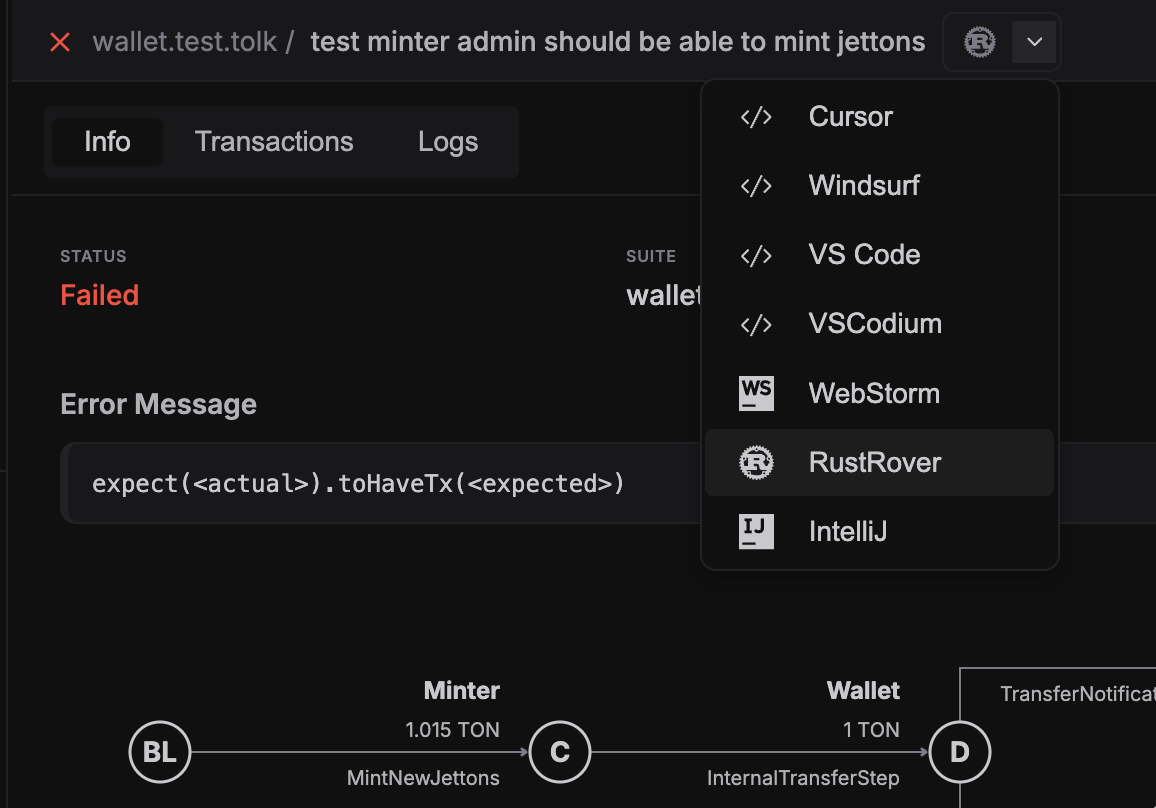
The selected test header contains:
- test status icon
- suite and test names
- quick-open button for current IDE
- IDE selector dropdown
Supported IDE deep links include Cursor, VS Code-family, and JetBrains IDEs.
Keyboard shortcuts
.opens current test location in selected IDEEsccloses IDE dropdowns
4. Info tab
The Info tab includes:
- test status
- suite name
- file location (
file:line:column) - duration and total transaction count
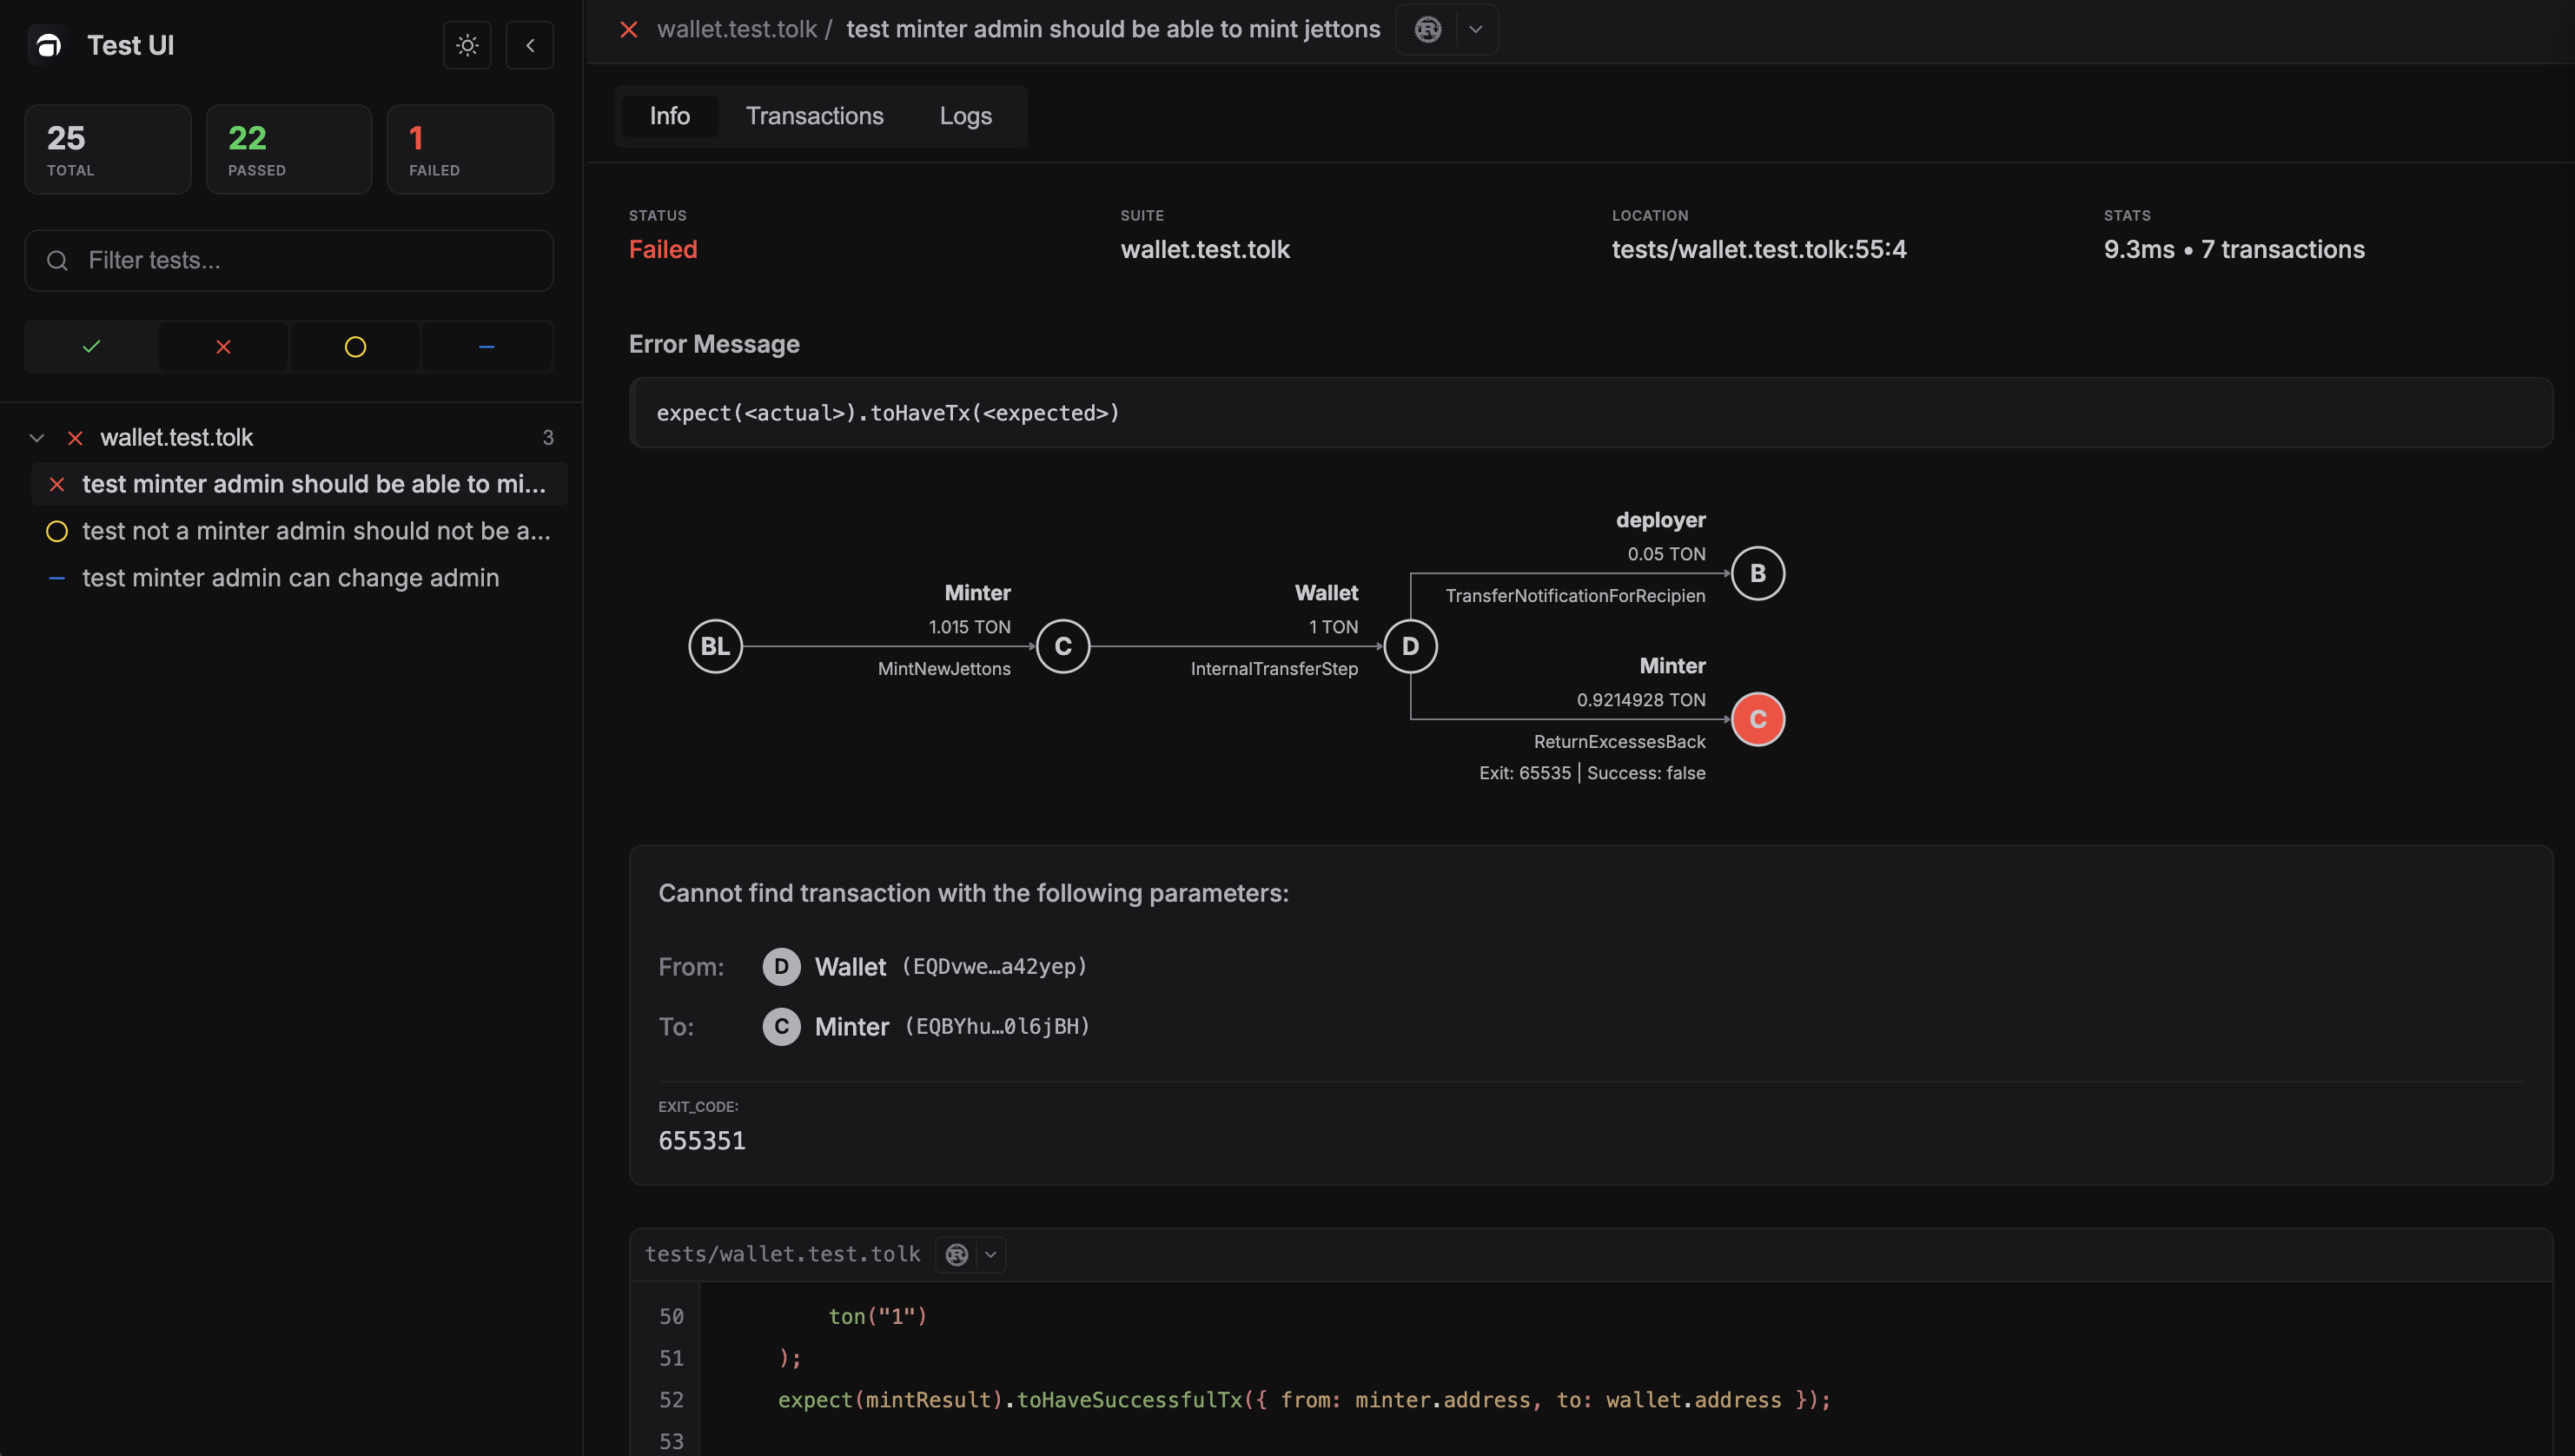
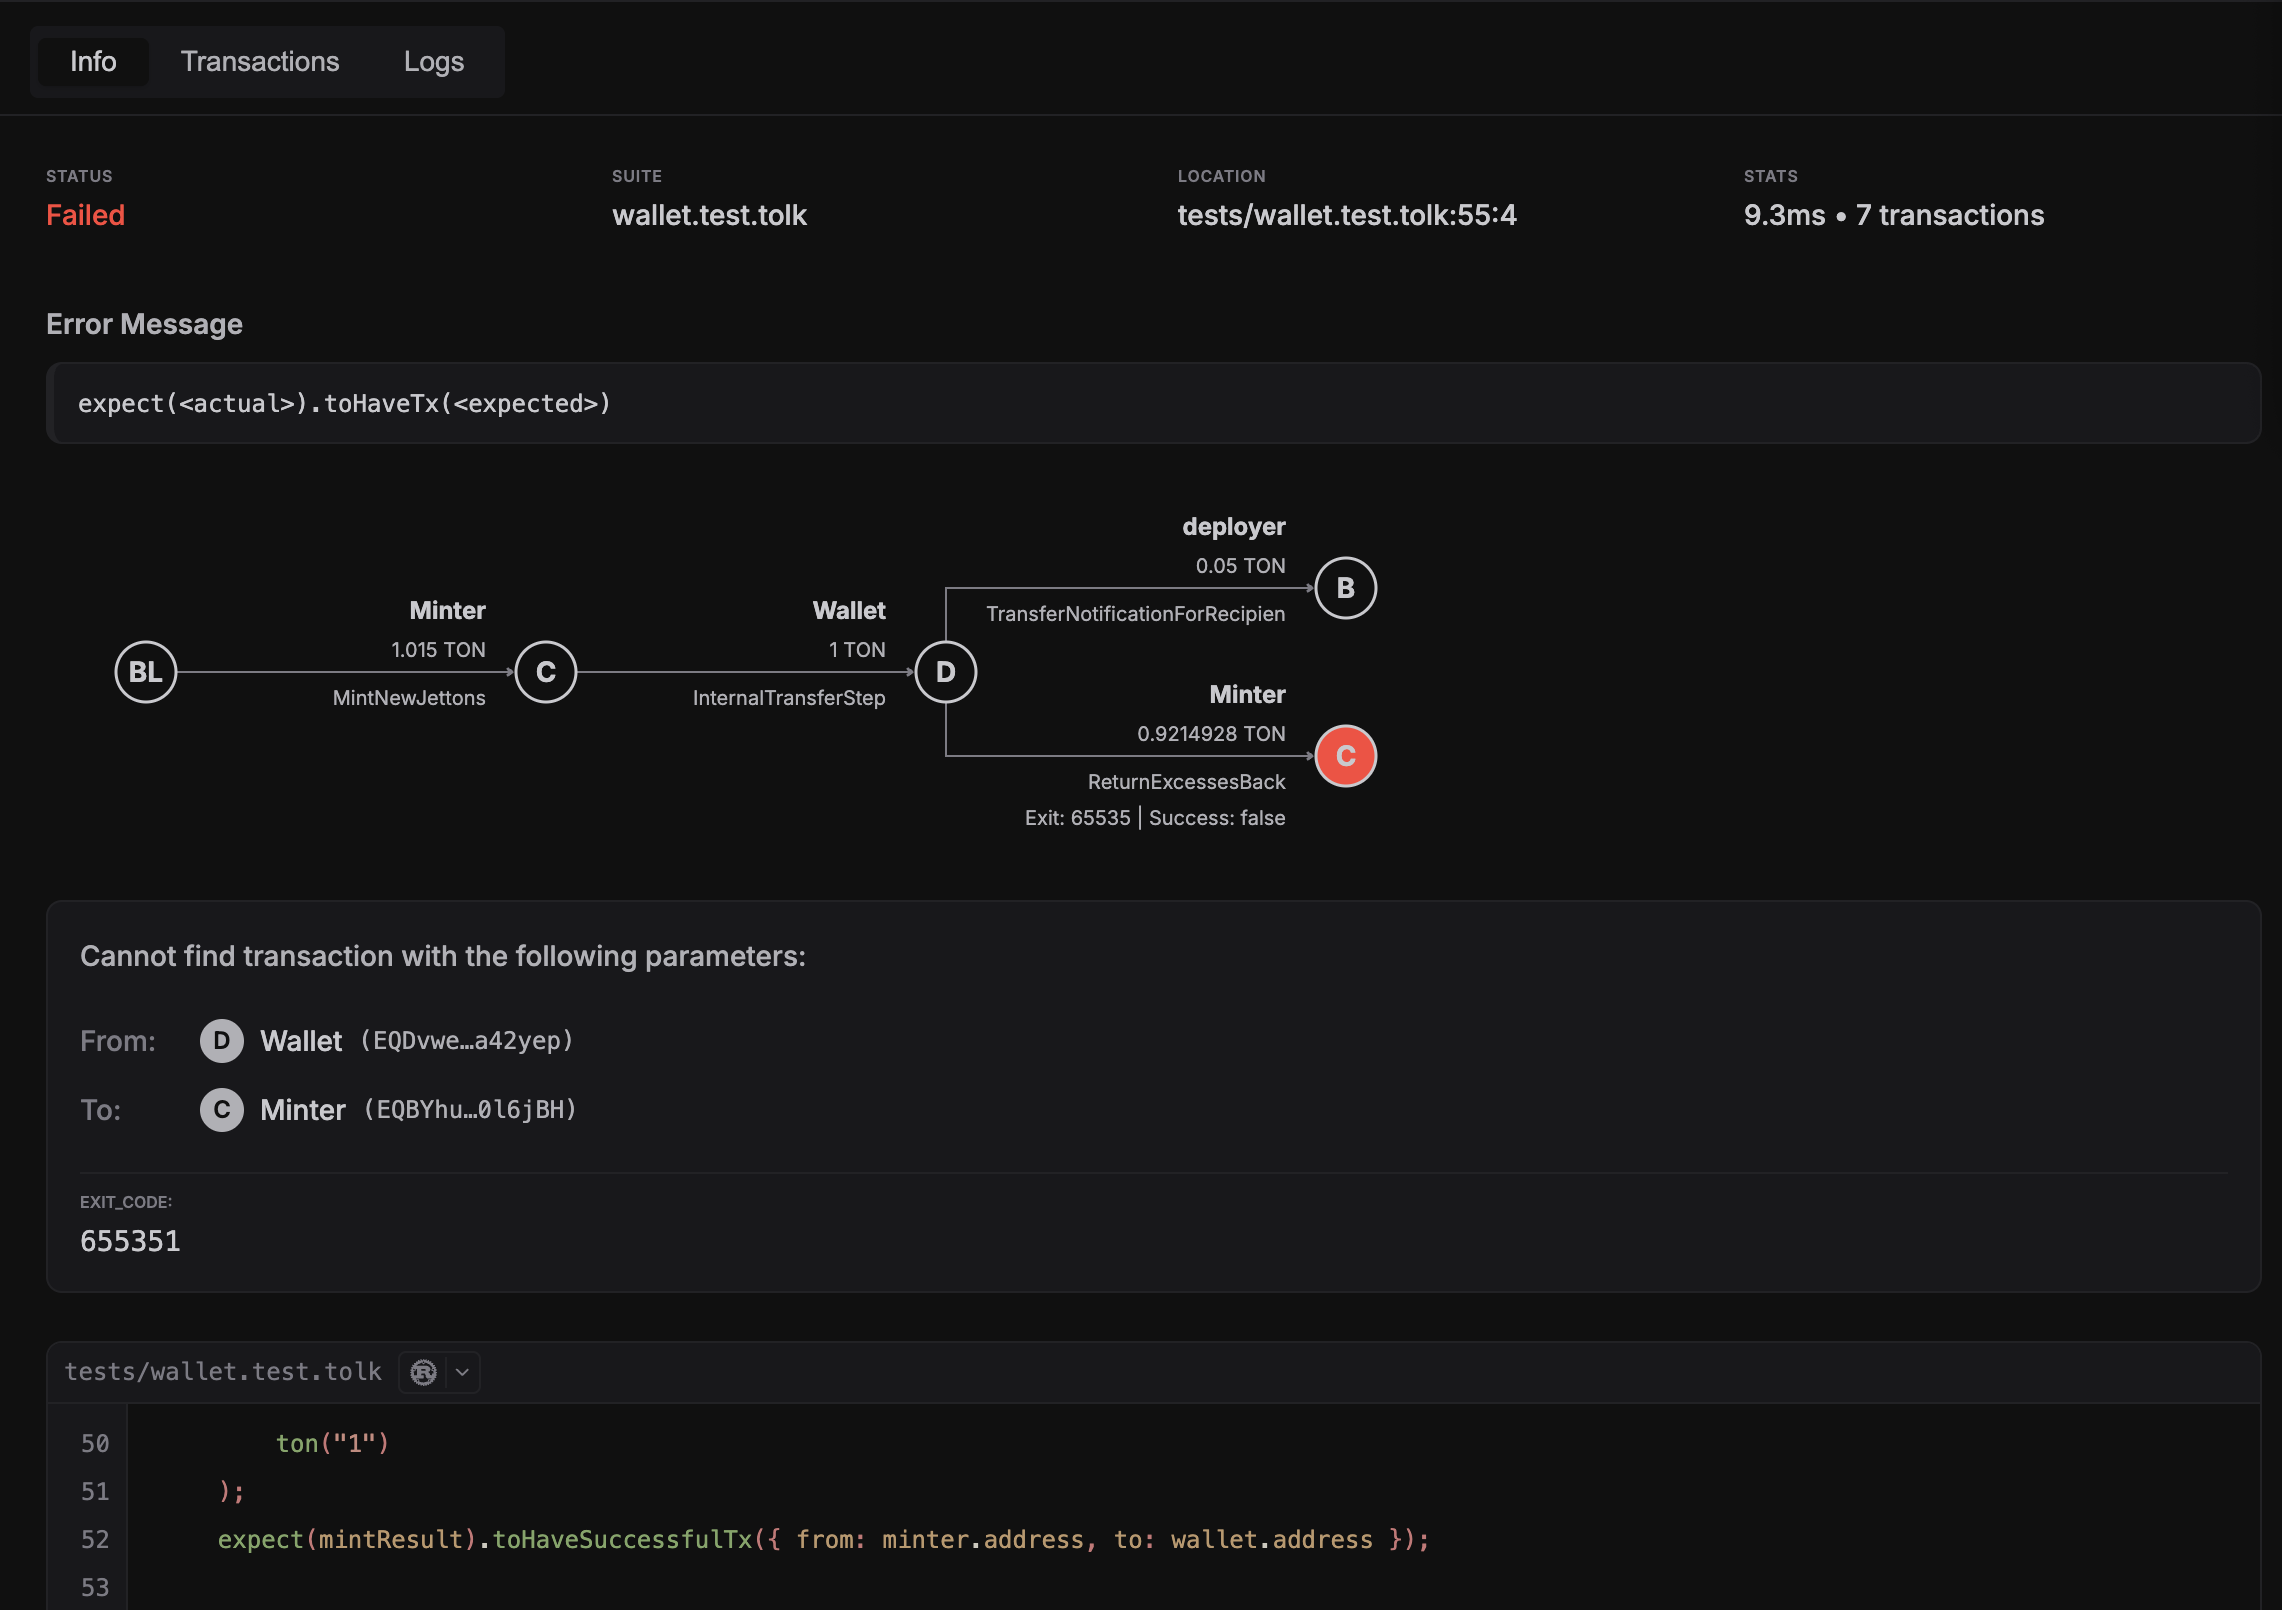
Failure diagnostics
For failed tests, Info tab also shows:
- error message block
- detailed matcher/exit-code message
- structured mismatch context for transaction assertions (
from,to, and matcher params) - failed transaction tree (if available)
- highlighted source snippet around failure location
Fee summary
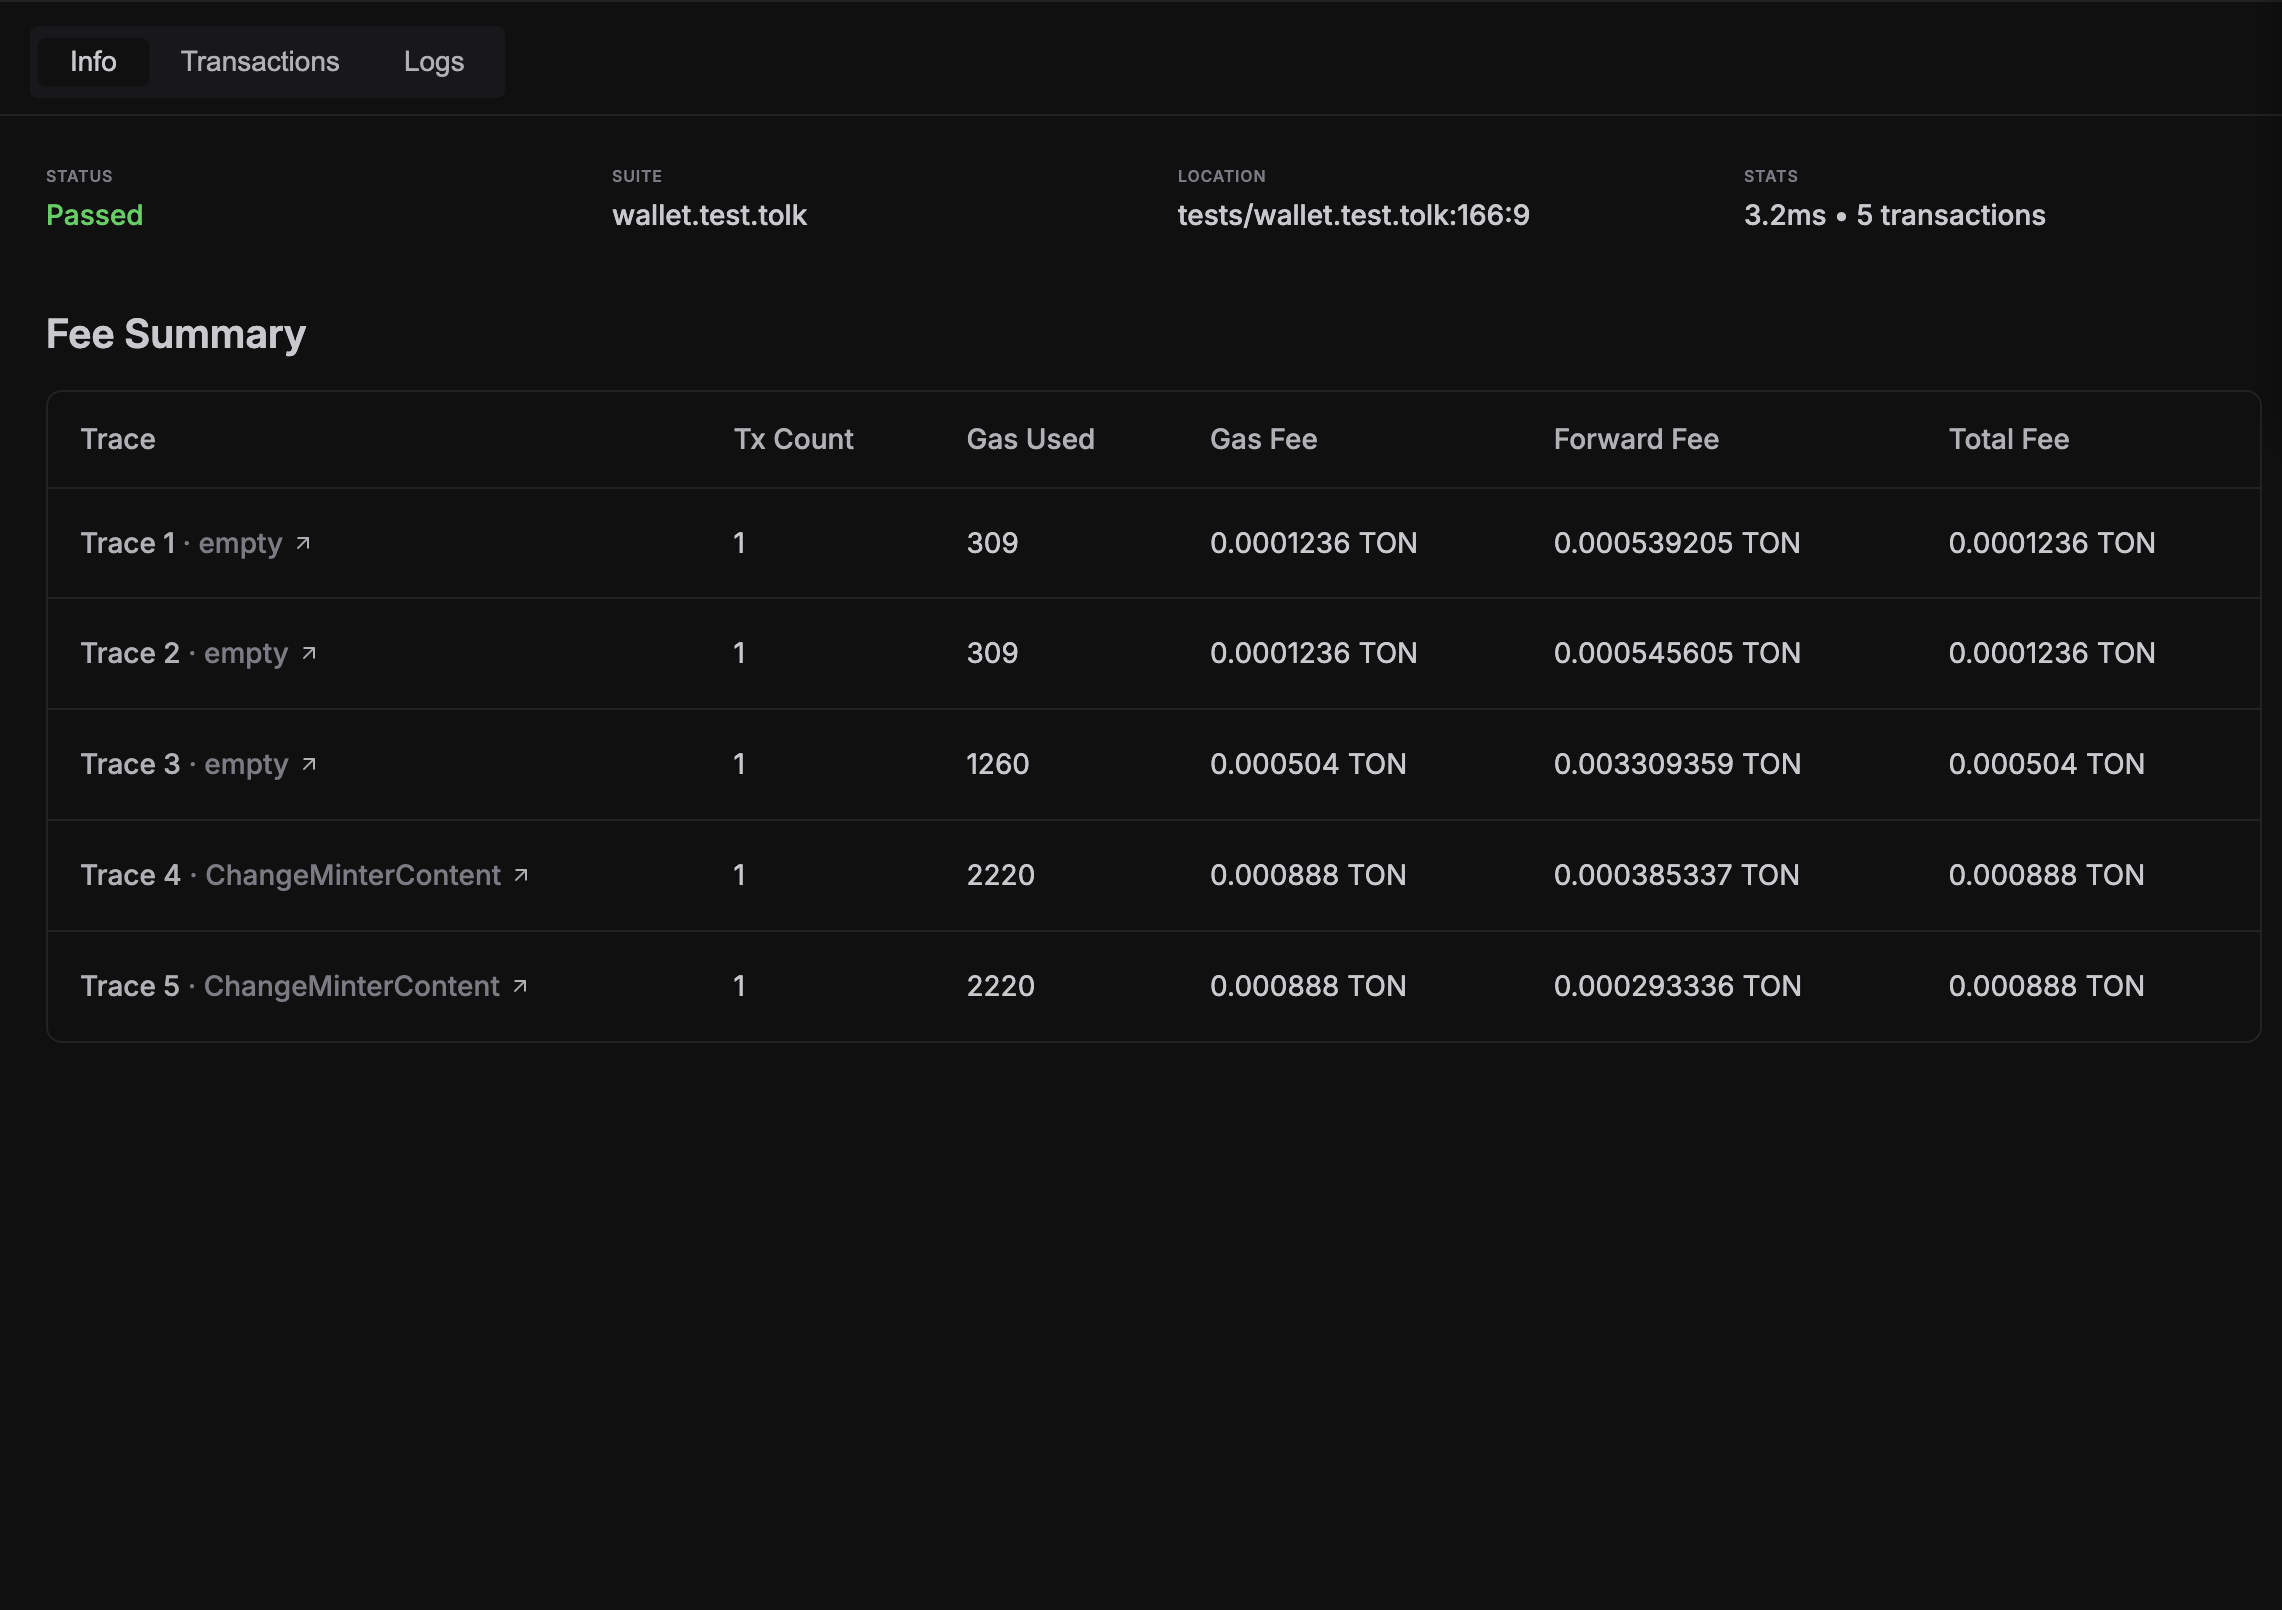
If traces are available, Info tab also shows Fee Summary table per trace:
- trace name
- transaction count
- gas used
- total fee
Clicking a trace row opens that trace in Transactions tab.
For baseline and regression-oriented fee analysis, see the gas profiling with snapshots page.
Name trace chains in tests with txs.giveName(...) to make trace tabs and fee summaries easier to read.
5. Transactions tab
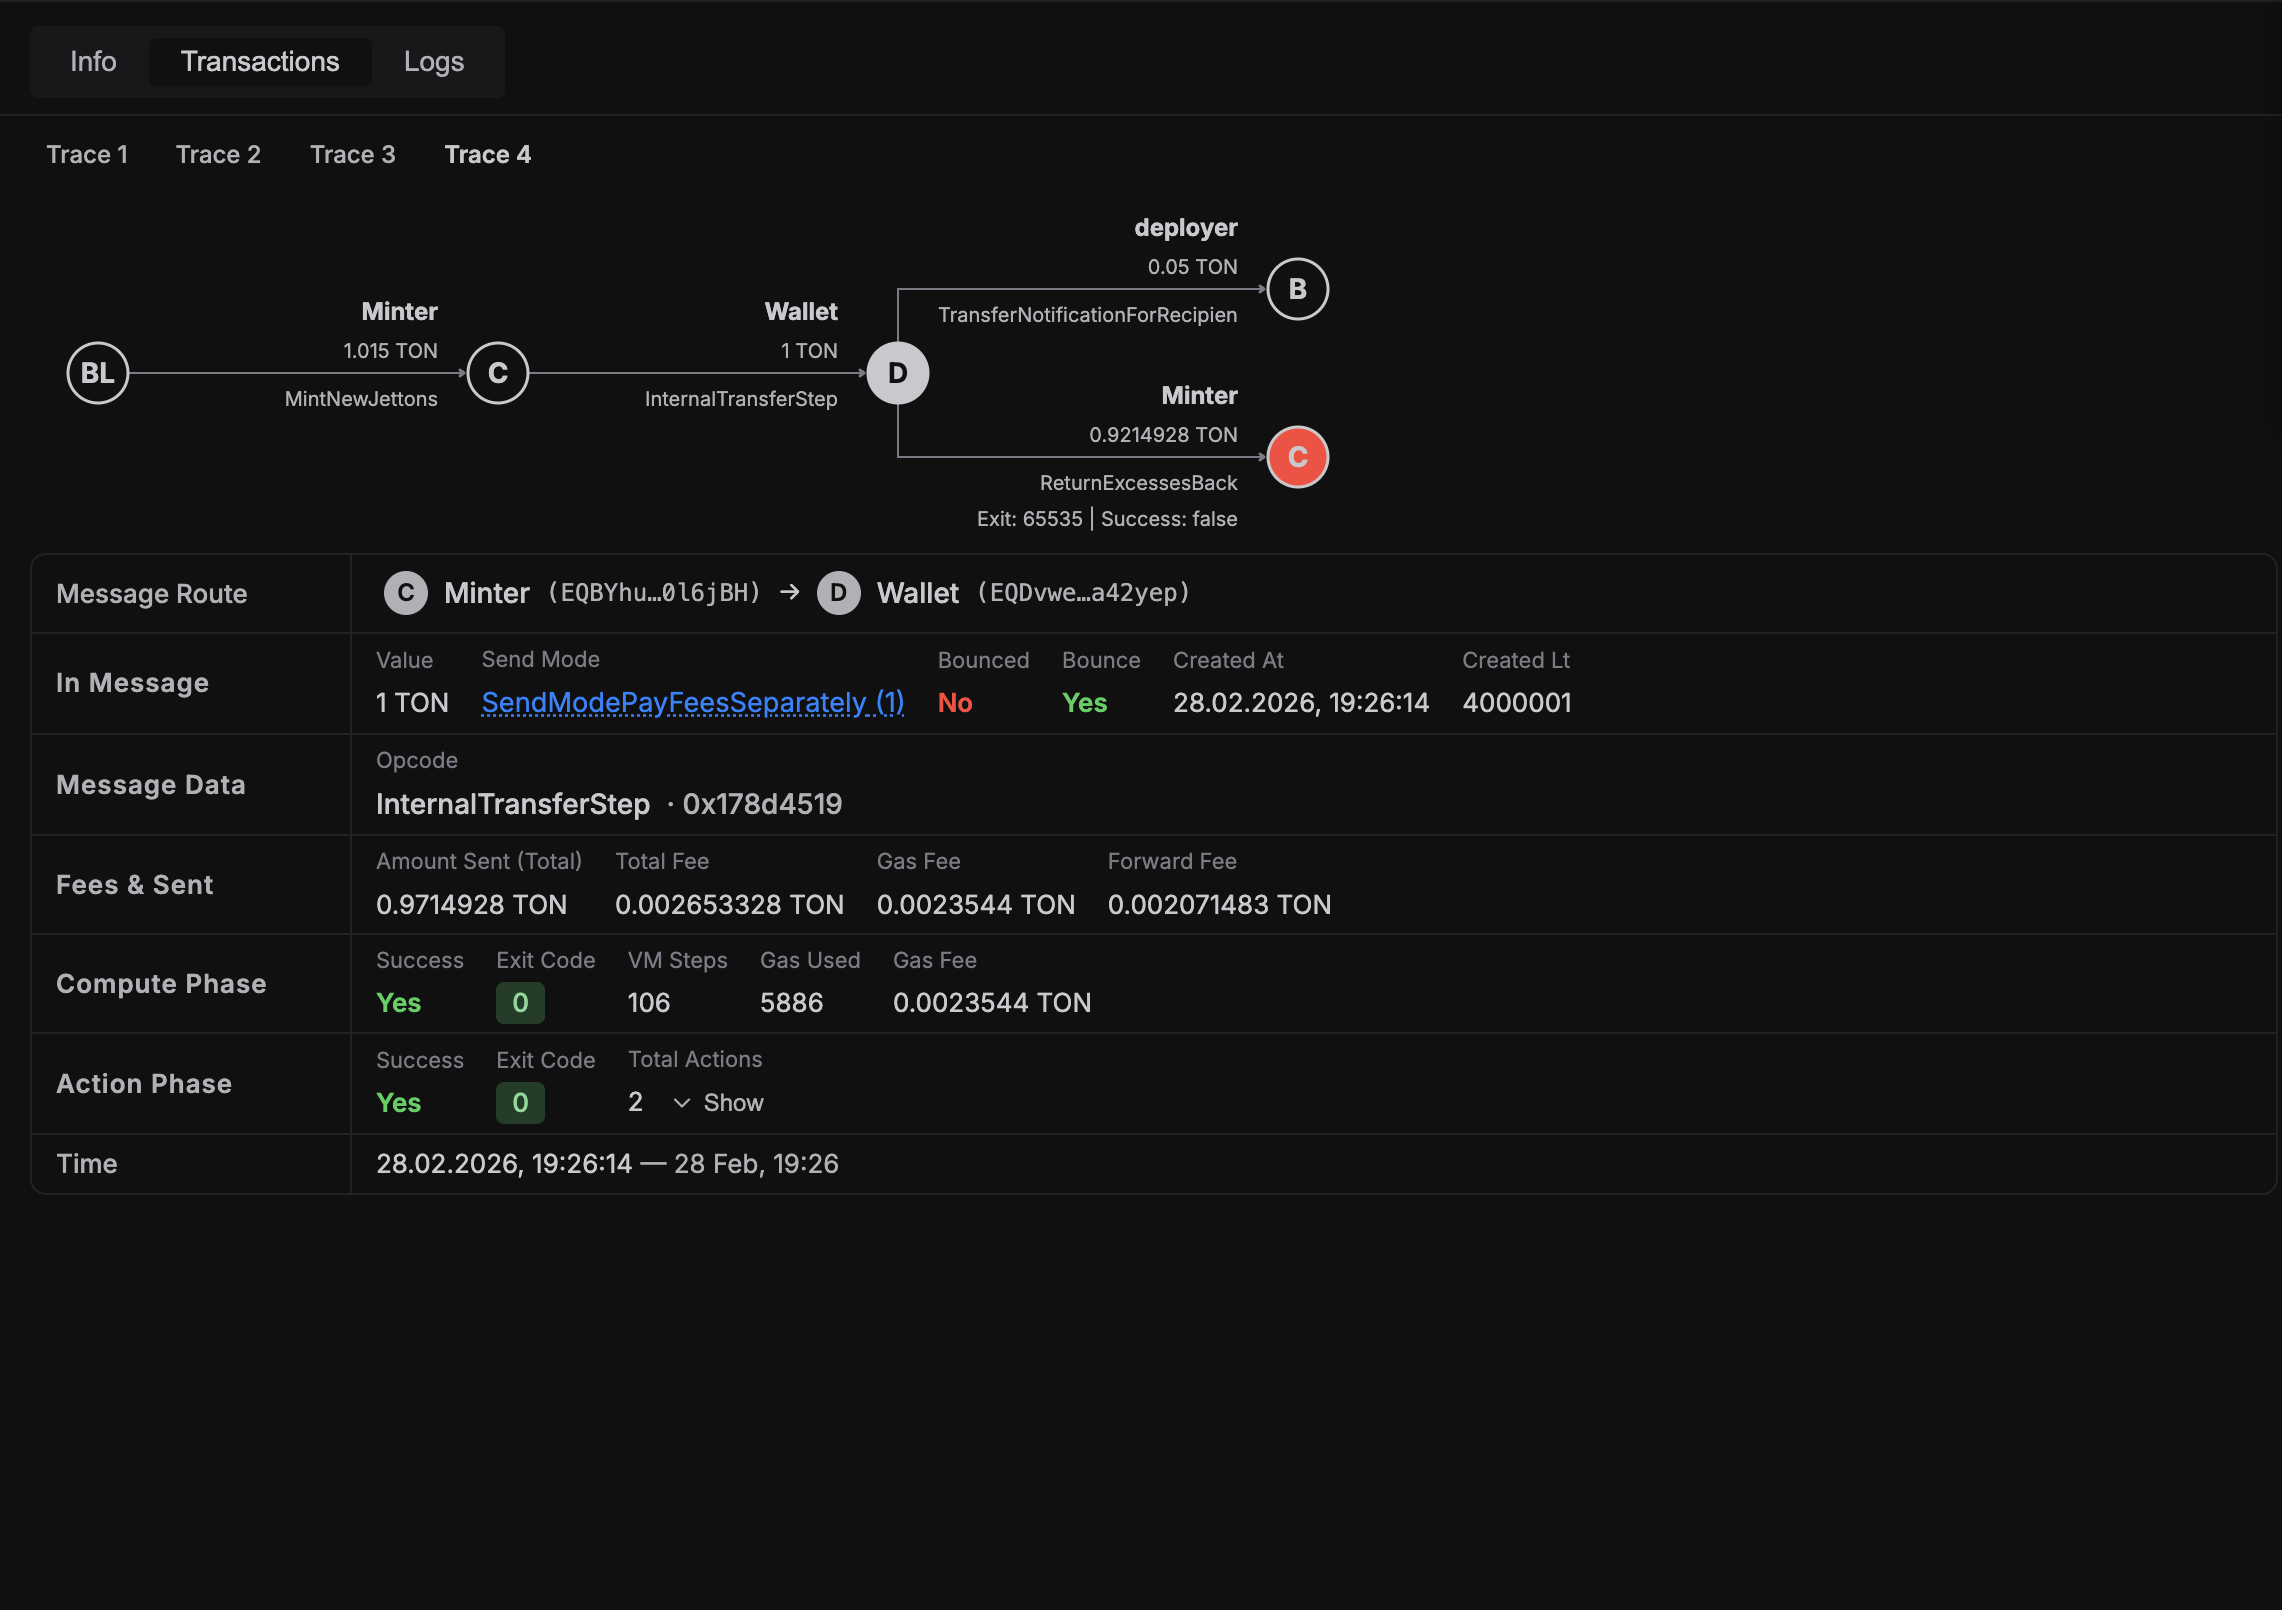
If a test has trace data, Transactions tab provides full tree visualization.
Trace switcher
- When a test has multiple traces, tabs appear above content
- Selecting a trace updates tree and details
Transaction tree
- Horizontal transaction tree with root blockchain node
- Node color indicates success/failure
- Dashed edges indicate bounced messages
- Hover tooltip shows route, state transition, and gas/exit-code details
Transaction details panel
Clicking a node opens detailed transaction view below tree:
- message route (
from -> to) and message metadata - opcode info with ABI name (when available)
- fee breakdown and compute/action phase status
- exit code details and quick copy controls
Actions details
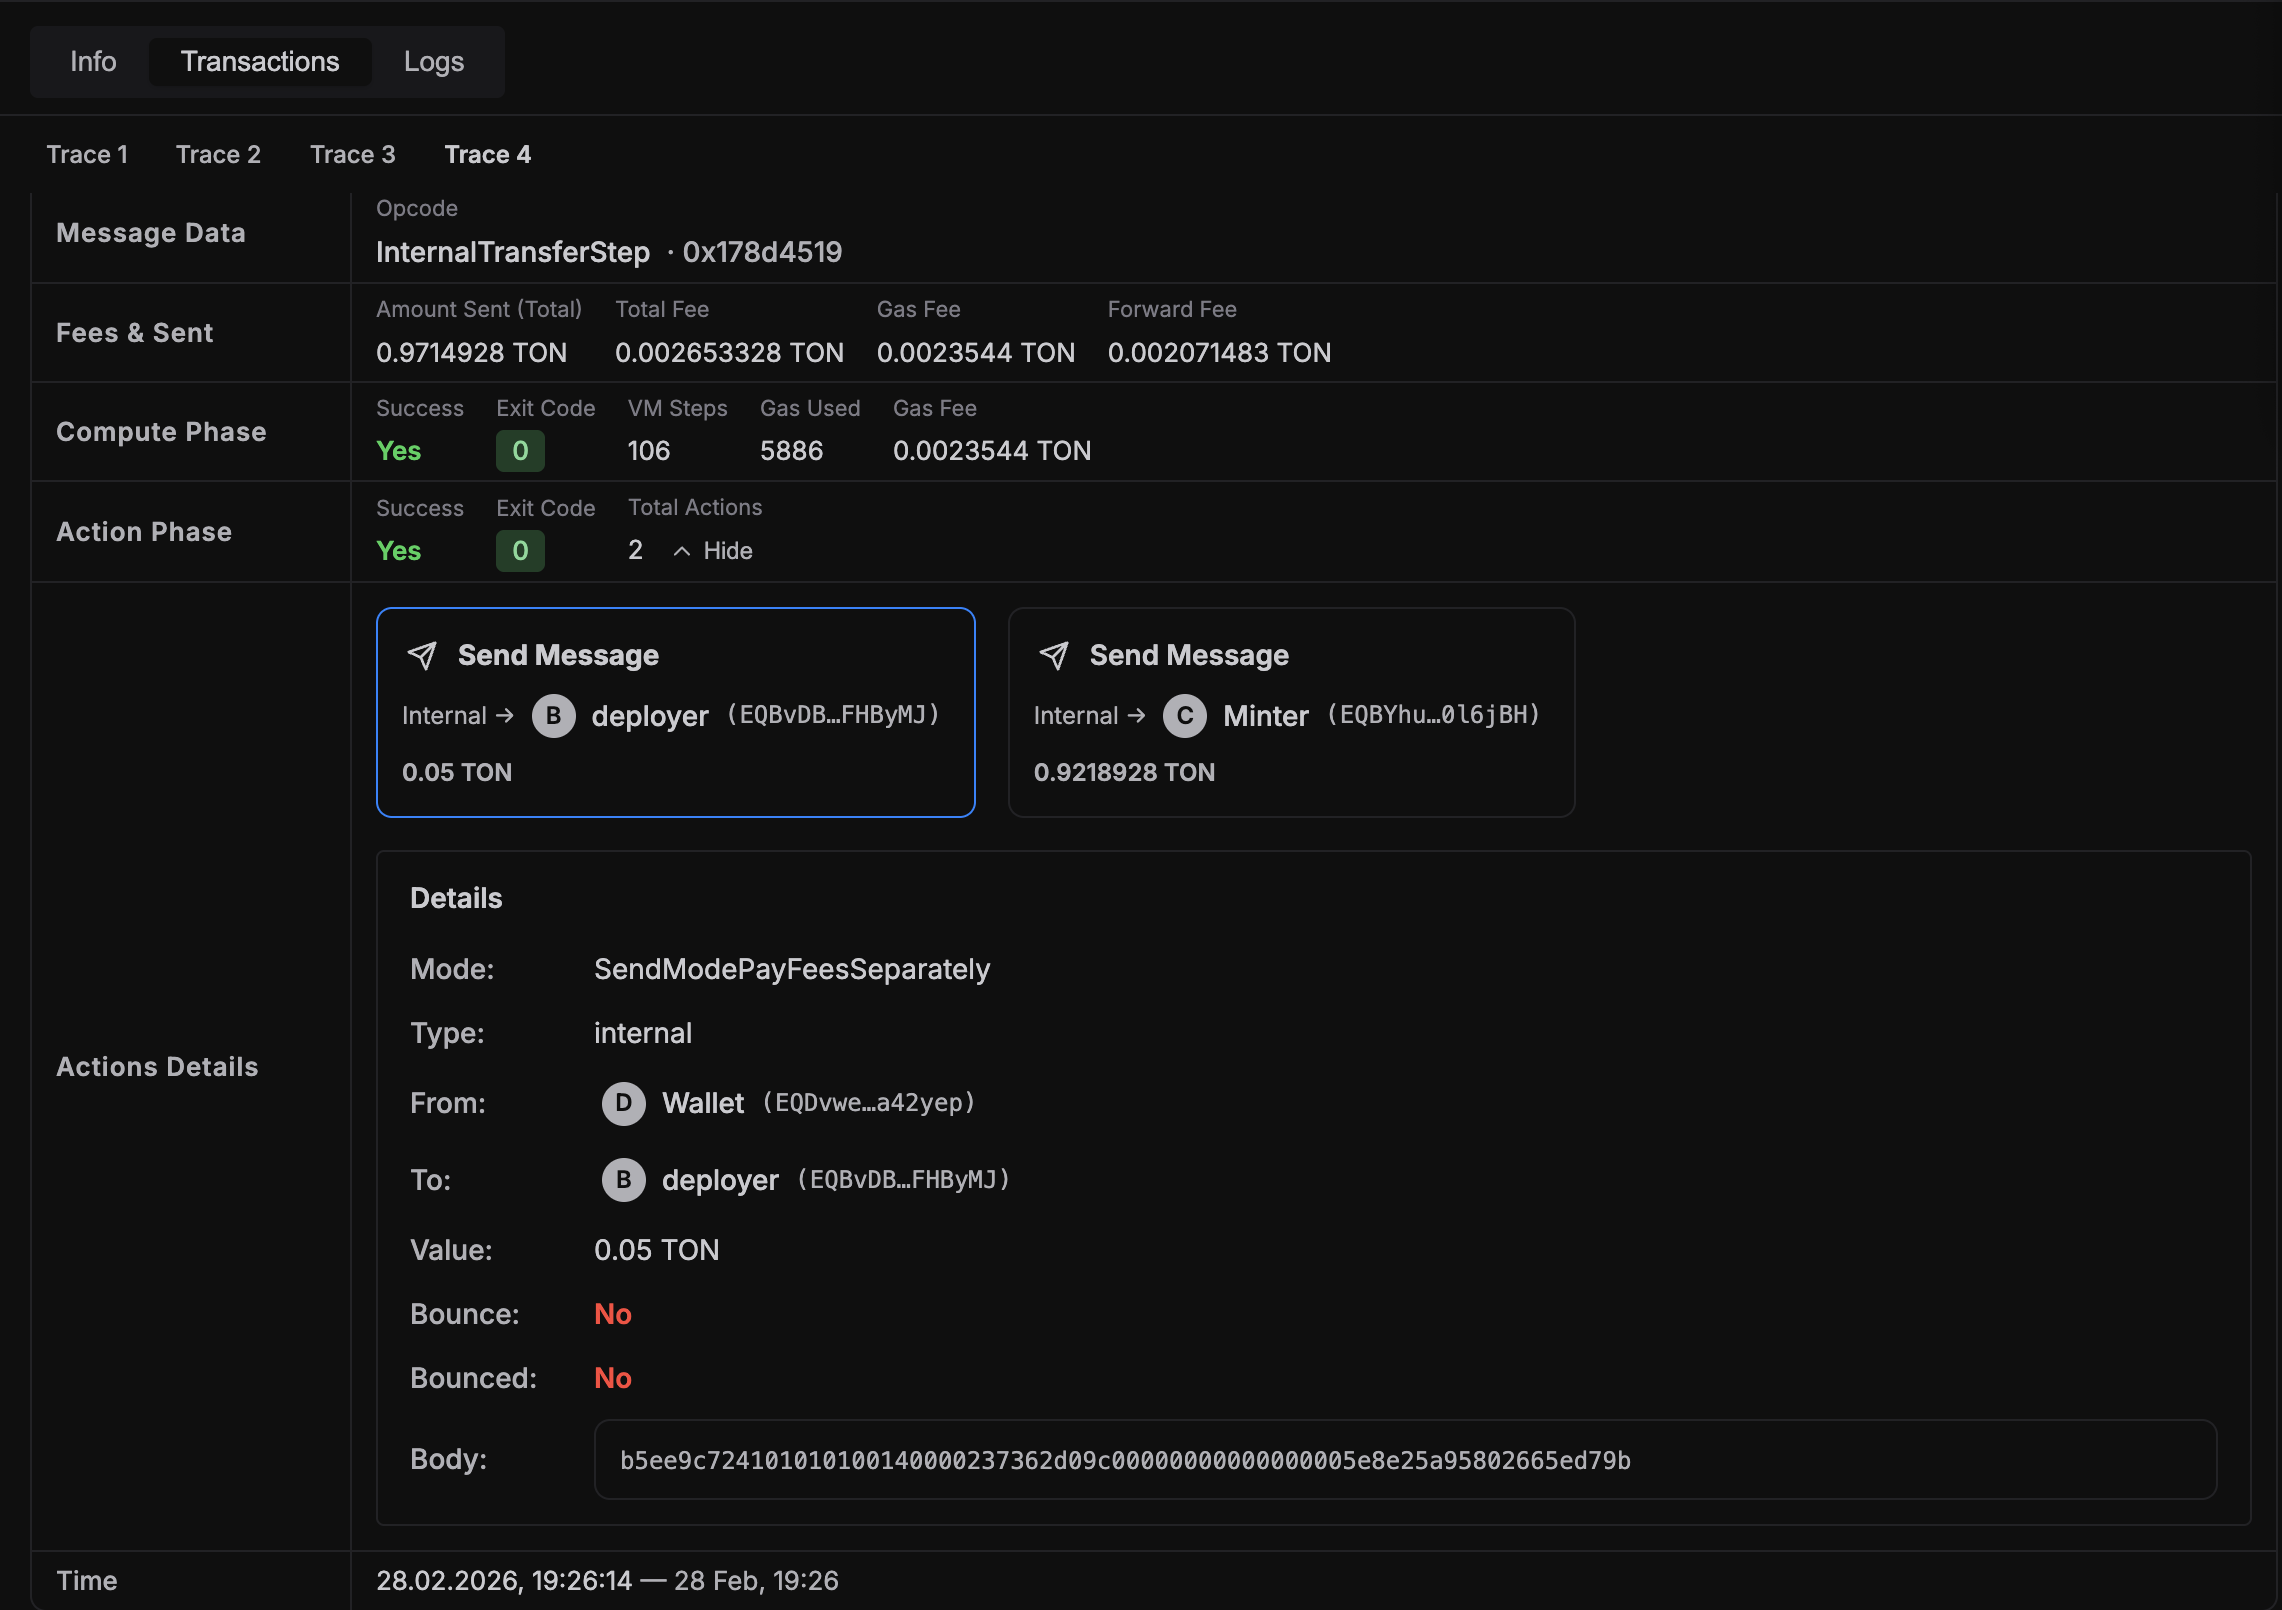
When action phase has out actions:
- action cards are shown (
sendMsg,reserve,setCode) - failed actions are marked with
Failedbadge - expanded action details include destination, payload, mode decoding, and failure reason
6. Logs tab
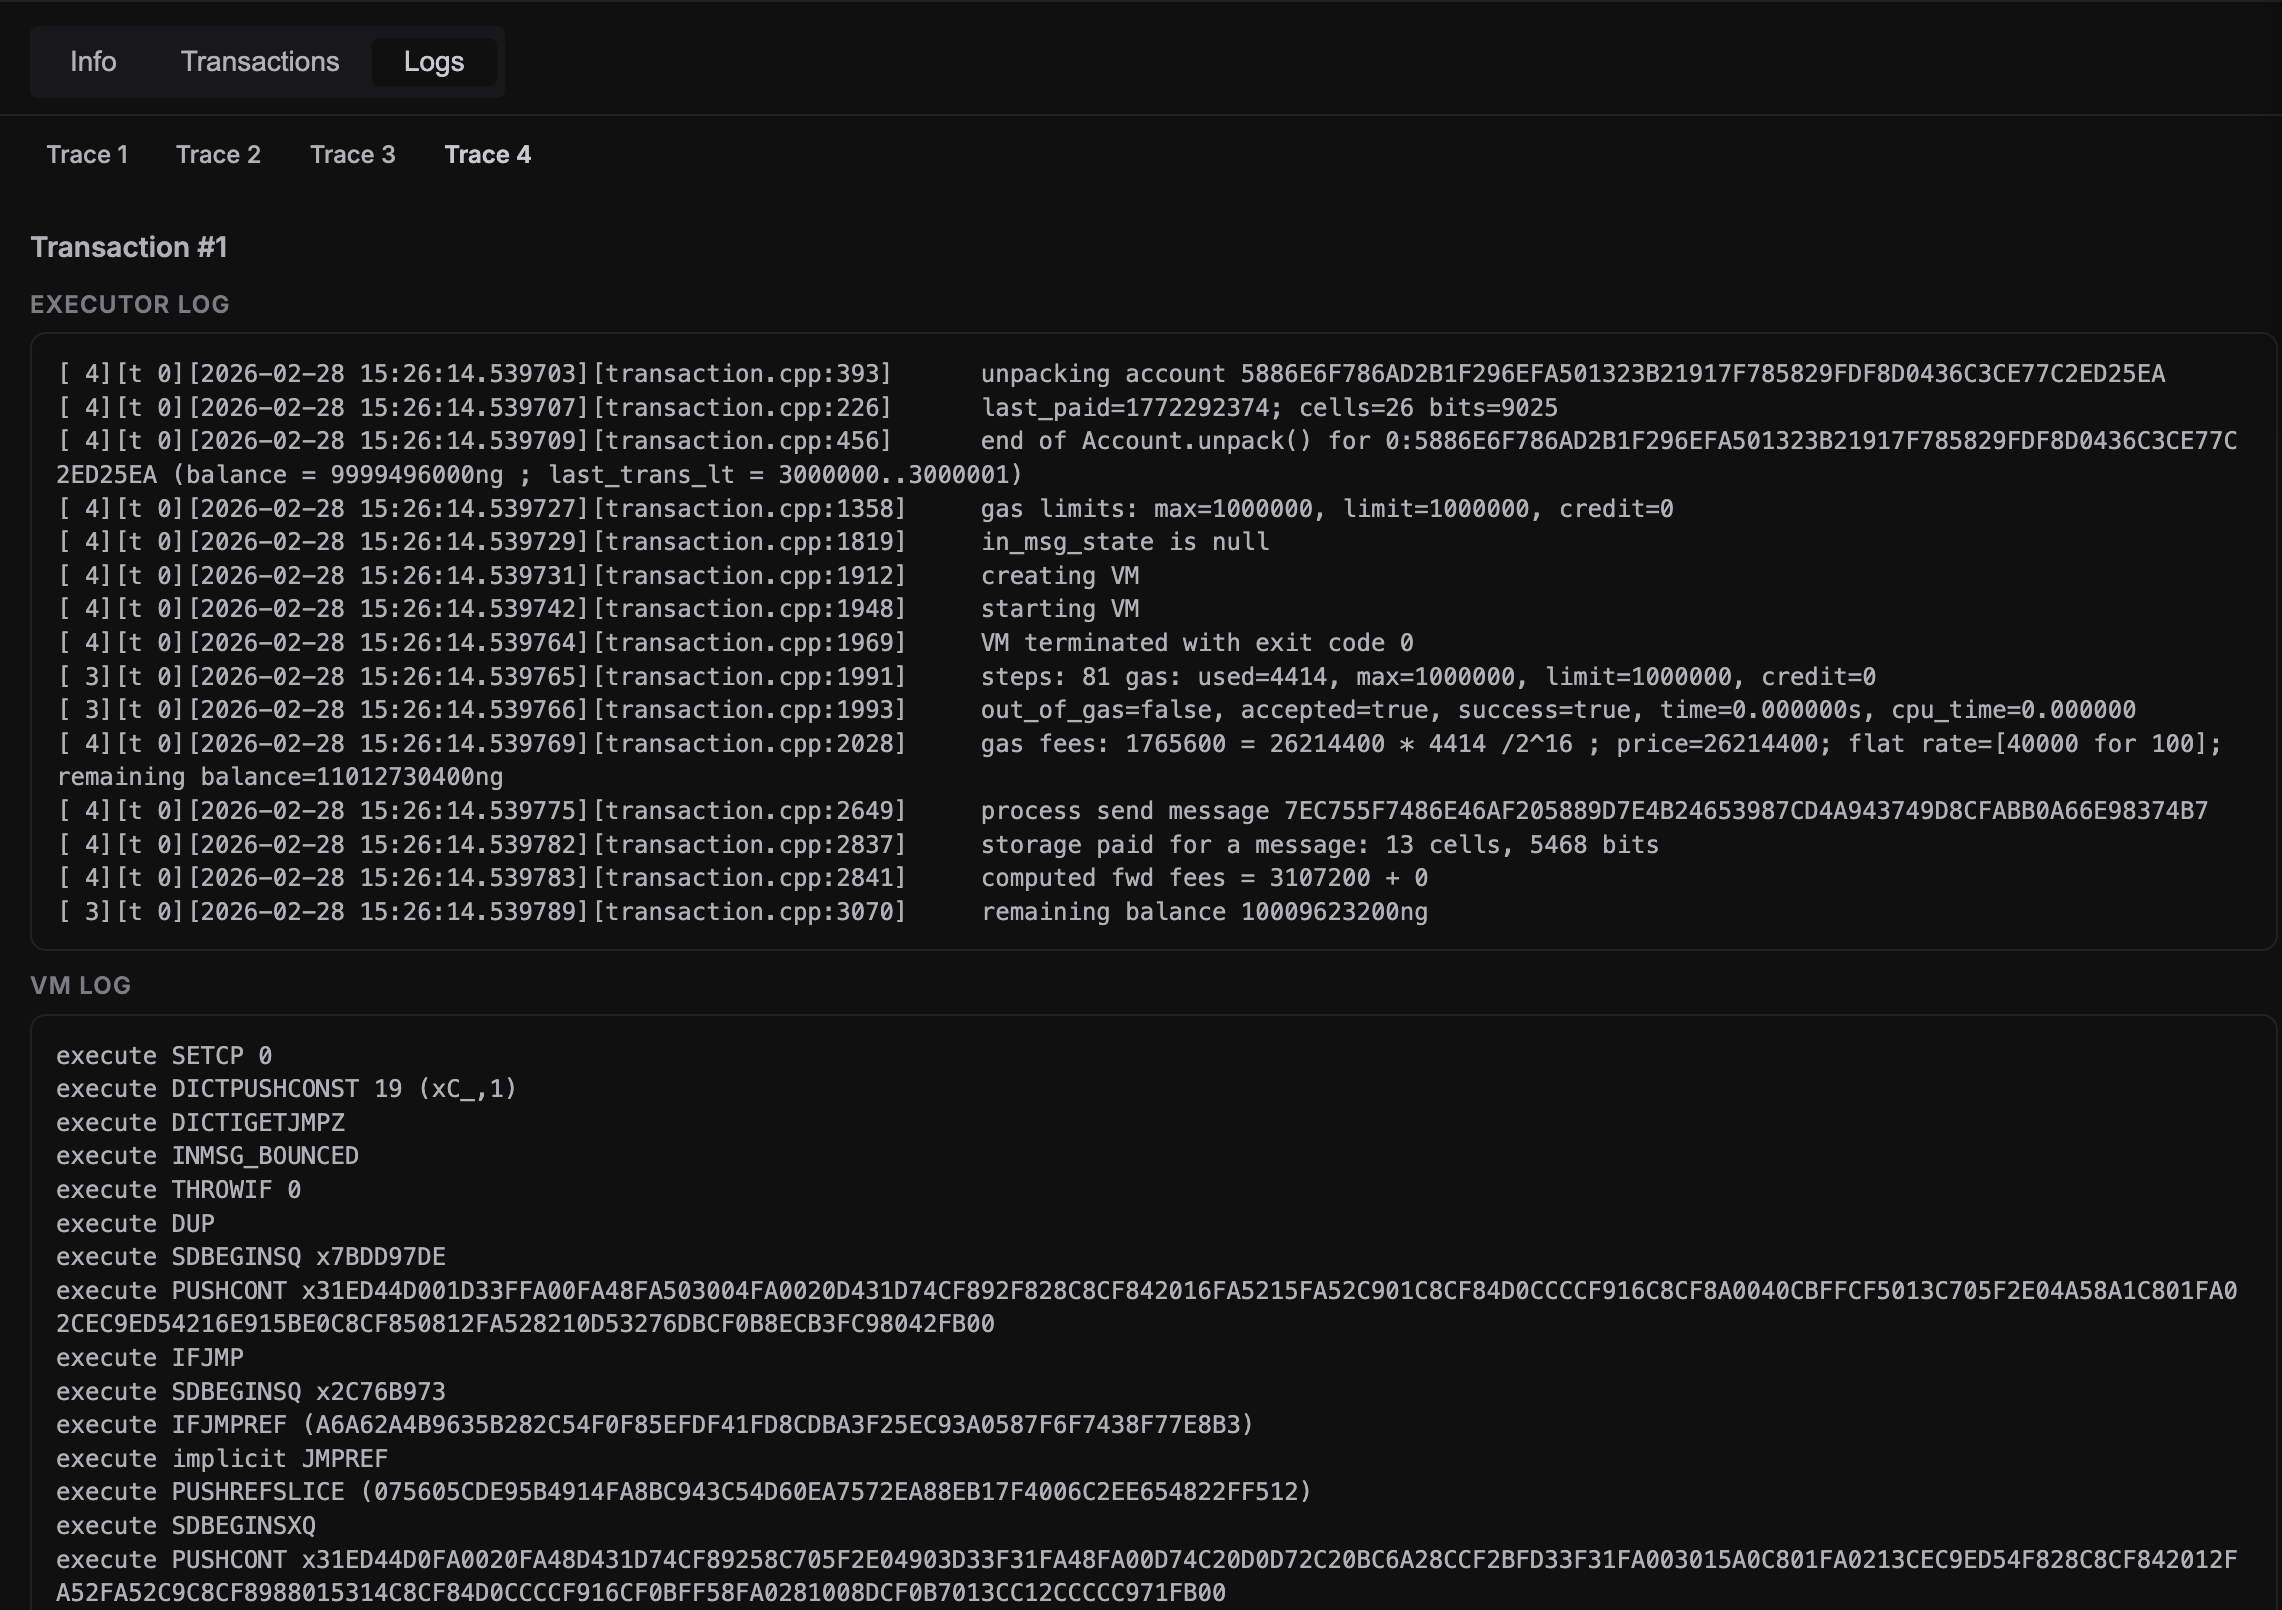
Logs tab shows Executor Log and VM Log grouped by transaction for the selected trace. If a transaction has no logs, it is skipped; if all VM logs are missing for the selected trace, UI shows a hint to rerun with acton test --ui --verbose.
7. Coverage tab
When the run includes acton test --coverage --ui, Test UI adds a dedicated
Coverage tab with:
- summary cards for overall coverage
- file list sorted by coverage score
- source viewer with annotated covered and uncovered lines
- search field for filtering files
The Coverage tab supports a quick visual scan of uncovered lines without leaving the browser UI.
Last updated on